

While the magnificent seven stocks have soared, each clocking gains of over 50%, the remaining 493 appear to have hit a plateau. This paints a unique picture for potential investors today. The S&P 500 essentially boils down to a handful of standout companies, accounting for 34% of the index’s weight, and sporting an average P/E ratio of around 50. It’s a case of a few stars shining brightly amidst a field of steady contenders. Inflection Point: Are equity expensive? Maybe the top 🔝 7, but it is hard to conclude in what macro scenario equity prices are! At the aggregate level, it’s a soft landing but many parts of the equity universe are much less upbeat about the economic outlook! Giorgio Vintani Tom Baldacci #equity #bloomberg #valuations #investing chart by Torsten Slok
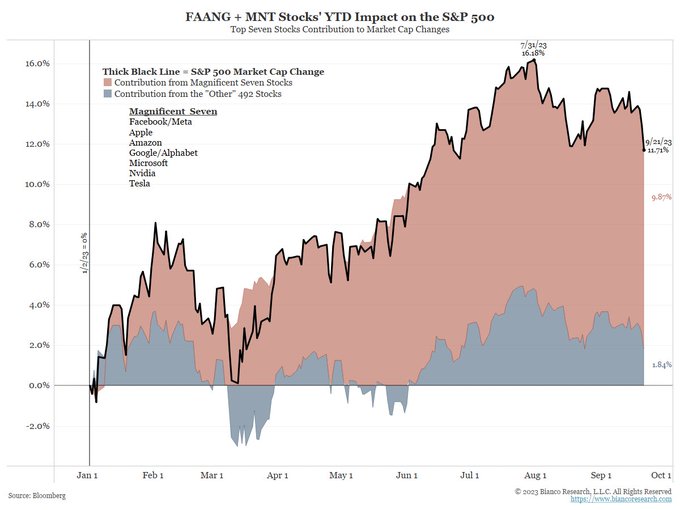
Jim Bianco, who also has been delving into this topic, presents a captivating chart above that vividly illustrates a notable trend: the rally, which hit its low point last October, has yet to broaden up.

This focal point becomes even more apparent when we examine the numbers:
Year-to-date, the market capitalization of the S&P 500 (SPX) has surged by a robust 11.71%.
Remarkably, a group of seven standout stocks, often dubbed the “Magnificent Seven” (Meta, Apple, Amazon, Google, Microsoft, Nvidia & Tesla) has claimed a significant chunk of this increase, contributing an impressive 9.87%.
In stark contrast, the remaining 493 stocks in the index collectively muster just a modest 1.84% of this overall gain. Peanuts! If you actually remove the seven largest tech stocks from the equation, the S&P 500 Index’s performance year-to-date hovers at a meagerly positive level. It’s quite remarkable that these “magnificent seven” stocks shoulder the lion’s share of the S&P 500 Index’s gains for the entirety of 2023.
ARE THE MAGNIFICENT 7EVEN ACTUALLY EXPENSIVE?
The $11 trillion (that’s their combined market cap!) question is: are these stocks overvalued?

This chart shows revenue and net income compared with the market cap as a percentage of the overall S&P500 index. Each of these stocks holds a large share of the market capitalization relative to their revenue and net income. Clearly, there are other contributing factors in play, such as growth, profit margins, market dominance, and more, all of which have bolstered the investment rationale for these stocks. It’s clearly essential to note that the statistics presented for these stocks do not offer a forward-looking perspective; they simply provide a snapshot of these companies’ current financial positions.
However, in terms of relative valuation, one stock that undeniably stands out is NVidia, which appears to be the priciest among this group. NVidia might find itself under scrutiny when it comes to its upcoming quarterly results, as it will likely need to provide compelling reasons for investors to maintain their faith in its prospects.

When we examine both forward and trailing price-to-earnings ratios, it’s evident that the leading seven stocks are currently trading near the higher bounds of their historical range. While they’ve certainly justified this premium multiple in the past, the big question lingering now is whether they can sustain it in the unpredictable days ahead.
As Giorgio may take the stage to mull over the enduring appeal of these stocks, we will take a look at the macro picture. A clear dichotomy emerges: the top-performing stocks, driven by the promise of AI and tech innovations, stand in stark contrast to the rest of the pack. The latter group seems to shout that economic growth is hitting the brakes and the Federal Reserve has applied a significant squeeze on financial conditions. The “bottom” 493 stocks in the S&P 500 likely offer a closer reflection of the current state of the U.S. economy.
InflectionPoint
Disclaimer
All views expressed on this site are my own and do not represent the opinions of any entity with which I have been, am now, or will be affiliated. I assume no responsibility for any errors or omissions in the content of this site and there is no guarantee for completeness or accuracy. The content is food for thought and it is not meant to be a solicitation to trade or invest. Readers should perform their investment analysis and research and/or seek the advice of a licensed professional with direct knowledge of the reader’s specific risk profile characteristics.
Leave a Reply