
Reviewing the Investment Case for EM Corporate Debt

#EmergingMarkets #MainFirst #CommoditySuperCycle #Greentransition #IMF
The annual IMF and World Bank meetings present the opportunity to discuss & re-think Emerging Markets Debt as an asset class. Since the Great Financial Crisis (GFC 2008), EM Debt has been a great asset class for tactical asset allocation, but it has been often very volatile. What do you think now of EM as a structural and strategic overweight for a global fixed-income asset allocation, where it is actually often under-represented? Do you see a case for it?
Let’s not forget that Emerging Markets are a broad investment universe that represents 86% of the world’s population, 58% of total GDP (on a PPP basis), and they account, even excluding China, for over 30% of global trade. Despite EMs being the most important engine of incremental global economic growth, they are often under-represented in the industry benchmarks. EMs represent only 12% of the MSCI world and around 15% of a classic global credit index. But despite EMs having faced headwinds in the last couple of years, many long-term trends remain in place. The commodity cycle is in the early stages of a long-term boom, green transition relies heavily on materials and metals often produced in EMs. Furthermore, let’s not forget that EMs are home to some of the most profitable companies in the world. For example, out of the top 50 most profitable companies in the world, about 15 reside in emerging markets.
Let’s go back to tactical considerations. Current valuations seem to price in a very adverse macroeconomic scenario. Is it now time to increase an allocation to emerging market debt?
Currently, nobody is overweighting EM assets, as investors’ disenchantment with the asset class has grown really high. But now, we see the opportunity, for long‑term investors, to potentially benefit from very attractive entry levels. It is definitely worth considering increasing exposure to the asset class on a gradual and measured basis. Some concerns are legitimate, but the key long-term themes remain valid. I would also like to add that the current global economic backdrop is leading to a gradual pick-up in the differential between emerging markets’ and developed markets’ growth rates. Europe is struggling with an energy crisis and rising inflation. The US economy will inevitably slow down in the face of aggressive monetary tightening by the Fed. Emerging markets will be the primary beneficiaries of rising commodity prices resulting from imbalanced commodity markets. During its last revision in July, the IMF cut the 2023 growth estimation for the US and Germany by 1.3% and 1.9% respectively, to 1% for the US and 0.8% for Germany. While countries outside the DM were not spared from growth cuts, the negative growth revision for EM was much lower than for DM. The chart below shows the growth differential between the main emerging and developed countries. After a long-term decline in the growth differential, EM countries are set to outperform and are probably going to see levels similar to those we saw in 2014.

Source: IMF, MainFirst
Growth rates are computed as the average growth rate of the 7 largest emerging countries (excl. Russia) and the average growth rate of the 7 largest developed countries. The differential is computed as the difference between these two averages.
Perfectly understandable, but all macro themes need a catalyst. Do you see a trigger for an inflection point in market sentiment?
We are still in the very early stages of a new commodity bull cycle. This structural trend will lift emerging markets assets materially over the next few years. I see several similarities with the last big commodity cycle.
The signal will come from the US Dollar.
In the last cycle, the US Dollar rose against all currencies until the end of 2001. While the Dollar weakened thereafter the commodities bull market ran its course and gave a tailwind to valuations in many commodity-producing emerging markets. Below is a chart of the US Dollar Index showing its top at the end of 2001 after which the commodity rally gathered steam. We are convinced that we are once more close to the market top for the US Dollar.

Source: Bloomberg
Let’s take a closer look at the price action for the CRB commodity index.
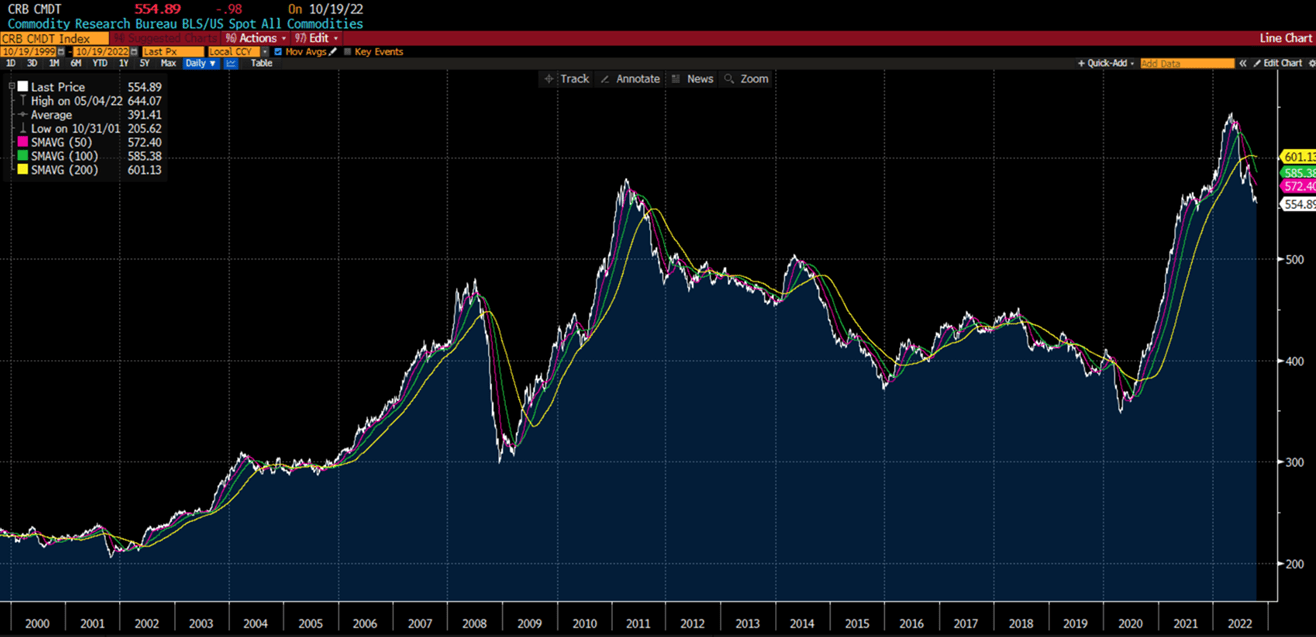
Source: Bloomberg
The commodity bull market started shortly before the US Dollar Index top was reached. We see a very similar setup right here in front of us.
Let’s talk about the downside risks. Investors are concerned about the impact of higher interest rates and QT for EM. Can we draw, for example, a parallel between the current market environment and the period of the Taper Tantrum in 2013?
We do not have the presumption to affirm that all emerging economies will perform well in the current environment. But today, when we look at the broad EM complex, we can say that it is less vulnerable than it was during the 2013 Taper Tantrum.
First, some countries improved their external positions. For instance, India has doubled its foreign exchange (FX) reserves since 2012. While its external debt also increased, it did so at a slower pace, improving the ratio of FX reserves over external debt and therefore improving the resilience of the country to external vulnerabilities. India, Mexico, China, and Korea all managed to decrease the weight of short-term debt over their external liabilities.
Second, central banks in Latin America were faster than the Federal Reserve in rising their policy rates to rein in inflation. Brazil, Mexico, Peru, and Colombia started tightening their policy rates back in 2021. This prevented large capital outflows and increased the real interest rate differential with the US, sustaining the currencies of Brazil and Mexico in particular. Latin America was the only region in the EM space reporting positive portfolio flows for the first eight months of 2022 with USD 37bn (IIF data).
Third, domestic bond markets are larger today than in 2013, this is due to providing additional refinancing options to EM countries, in particular in a situation of rising USD. As far as the USD is concerned, it is worth highlighting that the USD has risen sharply compared to G10 currencies but is more stable against EM currencies. BRL and MXN are both positive year-to-date. After the parabolic moves up of the USD this year, we believe that this trend might soon start to reserve as investors reduce their bullish bets.
Last, and most importantly from a corporate stability perspective, EM companies entered this downturn with solid fundamentals. As we can see from the chart below, plotting the Net-Debt-to –Ebitda ratio over time

the net leverage at the beginning of 2022 was at historically low levels. When compared to the rest of the world, EM corporates are also less leveraged. At the beginning of the year, US and European investment grade companies had net leverage of 2.4x and 3.1x respectively vs 1x for EM corporates.
Can you maybe bring some concrete examples? Are there EM corporates that are well-positioned to benefit from the current crisis?
Let’s consider Brazil for a moment. Brazil is the world’s fourth-largest commodity exporter, and its commodity export is broad and well diversified. From soft commodities like coffee, orange juice, soja beans, wheat, and sugar, to key industrial commodities like iron ore, copper, cellulose, and aluminium. Just to mention a few.
Brazil has an incredibly strong set-up to profit from an inflationary environment. The country has demonstrated its resilience and its ability to navigate inflationary times on several occasions. Not only in the 1970s but also more recently in the period between 2001 to 2011.
Furthermore, Brazil has also implemented, this time around, a 200billion USD investment program for infrastructure to support growth. This will be key to unlock efficiencies and will allow its economy to perform even better than in the last two inflationary cycles.
Now, let’s take a look at Petrobras as an example. The fundamentals of the company have dramatically improved over the years. Compared to 15/16 years ago, the company not only enhanced its production efficiency but also significantly improved its credit fundamentals.
I remember, for example, that in the last commodity cycle, Petrobras heavily invested in exploration and drilling in the pre-salt oil reserves in the Santos Basin. Back then, their debt grew to over 130 billion $ while their oil production was just a fraction of what it is today. Today, Petrobras is a very different company. It is now at one of the strongest points it has ever been in almost two decades. It produces 2.6million barrels per day and is about to expand production further to 3.2 million barrels per day over the next 3 years. Their debt level is below 40 billion USD, which is less than one-third of what it was in 2016. Net debt is now less than 40% of total capital. Furthermore, In terms of bottom-line metrics, margins are also impressive. PBR enjoys a net margin of 28.4%. These levels are again competitive, even when compared to leaders in the oil sector such as XOM (whose net profit margin is 10.9%). At the same time, the company will pay more than 120 billion $ in taxes and royalty fees to the Government over the next 4 years besides paying a double-digit dividend yield.
But, If we look now at market pricing, Petrobras bonds trade at a spread that is much higher than before, while its credit profile can be considered as a good as a strong investment-grade company. This is a clear dislocation, in our view.
Brazil stands out as a solid investment story. Inflation has been consistently revised down and GDP growth revised up, over the past several quarters. During the last commodity super-cycle, Brazil’s rating moved from a low BB to investment grade (BBB Moody’s/S&P). We may see a repeat of this…
Gran Tierra is another great example. That’s a relatively small company focused on oil and gas exploration and production in Colombia and Ecuador, with an average production of 32,000 barrels per day. The company has been very disciplined in reducing its leverage and effective in delivering material free-cash-flows. To put it into context they have a net debt under $400 million and a net debt to EBITDA of under 0.7x. Gran Tierra generates a free cash flow after exploration of $180 – $200 million, which covers already 50% of their net debt! Despite fast-improving fundamentals, the price of the bonds dropped significantly. It trades now around 78 cents, with a bond yield of 14.3%.
If the bond price recovers, going back to 100, we are talking about a total return potential of 40%.
I would also add that the underperformance of fixed income compared to equity has been quite remarkable! As we can see in the chart below, the equity price of Gran Tierra has been very resilient

Source: Bloomberg
With the bonds continuing to sell off.

Source: Bloomberg
There are plenty of these opportunities in the EM corporate space. This year the default rate is particularly high on a historical basis. But if we look closely, the bulk of the defaults have been concentrated in China real estate, Russian and Ukrainian corporates. If we strip out those, the default rate in the broad EM corporate universe is a mere 1.5%. So, it’s not all doom and gloom, there are also many sweet spots. Times of stress create opportunities and patient investors can now pick out several attractive opportunities.
What is your biggest high conviction right now?
That’s commodities. Our very constructive view on commodities is driven by many years of underinvestment in the oil & gas and metals industries. This, together with the transition from fossil fuels to more environmentally friendly alternatives and the conflict in Ukraine, has created the perfect storm for high commodity prices in the longer term.
Following the strong economic recovery in 2021, oil inventories are now at historically low levels. The sanctions against Russia contribute to additional shortages in the market. Europe still imports oil from Russia, but as part of its sixth sanctions package, the EU said it would halt imports of Russian crude by the sea in December and also ban imports of petroleum products from February 2023. Russia supplies 27% of the total oil import to Europe. As Europe moves away from Russian oil, we expect additional tightness in the market which will lead to higher oil prices. Some could argue that the energy crisis can be solved by drilling more. However, this crisis started before the war in Ukraine and many of the problems are structural. Investors have been (and are still) asking oil companies for more investments in renewables. Because of this, producers like Shell and Exxon are increasing their investments in solar systems and wind turbines, taking away resources for oil and gas exploration. The result has been a decline in investments for new oil production of around 70% since 2014. Even if more is invested now, it will take years to increase production in a sustainable way. In the next few years, we will have to live with a tight supply of oil and gas. This is also because the population of emerging markets (around 7 billion today) is set to increase further, and demand will remain high. Today an Indian consumes on average 1 barrel of oil per year, an American 18 barrels.
The energy transition will also require a large number of base metals. Copper, nickel, and lithium are just some of the minerals that are needed for green technologies. These base metals are mainly coming from emerging markets. As an example, 40-45% of copper comes from Chile, Peru, and Mexico while 50% of nickel comes from Indonesia and the Philippines. Demand for minerals linked to the green transition is expected to at least double by 2040. Electric vehicles, an important tool to achieve the green energy agenda of governments worldwide, use almost six times more minerals than normal cars. We believe that the mining industry like the oil industry has underinvested for years, and will struggle to meet this increase in demand. It takes 3-5 years from the discovery of a raw material deposit to the first production.
All this can only mean one thing: higher prices.
A final question on your investment approach. How do you and your team put together your investment ideas and build up the portfolio?
The playbook for allocating to EM has changed. We can consider EM fixed income as a broad mosaic of investment themes. Our balanced approach is well-positioned to take advantage of the highly diverse and constantly changing investment landscape. First of all, we diversify between high-quality investment-grade and more high-beta high-yield issuers. Our significant allocation to investment-grade corporates takes advantage of the fact that nowadays EM is home to many world-class companies, which are leaders in their respective sectors. Second, we allocate to companies with a solid edge in the oil and gas space. Third, as we discussed, we allocate to those firms that are essential in the supply chain of the green transition. We also take advantage of special situations, where fundamentals are weaker, but the risk-reward is absolutely compelling, like for example China HY. EMs tend to be less efficient and research coverage s often lower than in the developed world, making them a fertile hunting ground for alpha opportunities.
We are a team of 4 managers/analysts, Cornel Bruhin, Roman Kostal, Carloalberto Fraccaro, and me. Our Team has the right mix of experience to both identify bottom-up alpha sources and construct diversified portfolios to benefit from long-term structural macro themes!
Interview with – Andranik Safaryan

Andranik Safaryan joined MainFirst in January 2022 as Lead Portfolio Manager of the Emerging Markets team. He is responsible for emerging markets investments for the MainFirst Emerging Markets Corporate Bond Fund Balanced and the MainFirst Emerging Markets Credit Opportunities Fund. Previously, he was with Credit Suisse Asset Management AG in Switzerland for 10 years, where he most recently held the position of the Co-Manager of Credit Suisse (Lux) Emerging Market Corporate Bond Fund. In this role, he managed assets of approximately USD 3 billion, including approximately USD 2 billion in a mutual fund and USD 1 billion in a range of mandates. Andranik Safaryan holds a Master of Arts in Economics from the University of St. Gallen in Switzerland. He is also a Chartered Financial Analyst (CFA), a Certificate in Investment Performance Measurement (CIPM) charterholder, and a Certified Financial Risk Manager (FRM®).
Disclaimer
All views expressed on this site are my own and do not represent the opinions of any entity whatsoever with which I have been, am now, or will be affiliated. I assume no responsibility for any errors or omissions in the content of this site and there is no guarantee for completeness or accuracy. The content is food for thought and it is not meant to be a solicitation to trade or invest. Readers should perform their investment analysis and research and/or seek the advice of a licensed professional with direct knowledge of the reader’s specific risk profile characteristics.
Leave a Reply